Choosing Your Dashboard View
Create briefing, command centre and board dashboards, choose a template, customise their cards and share a dashboard.
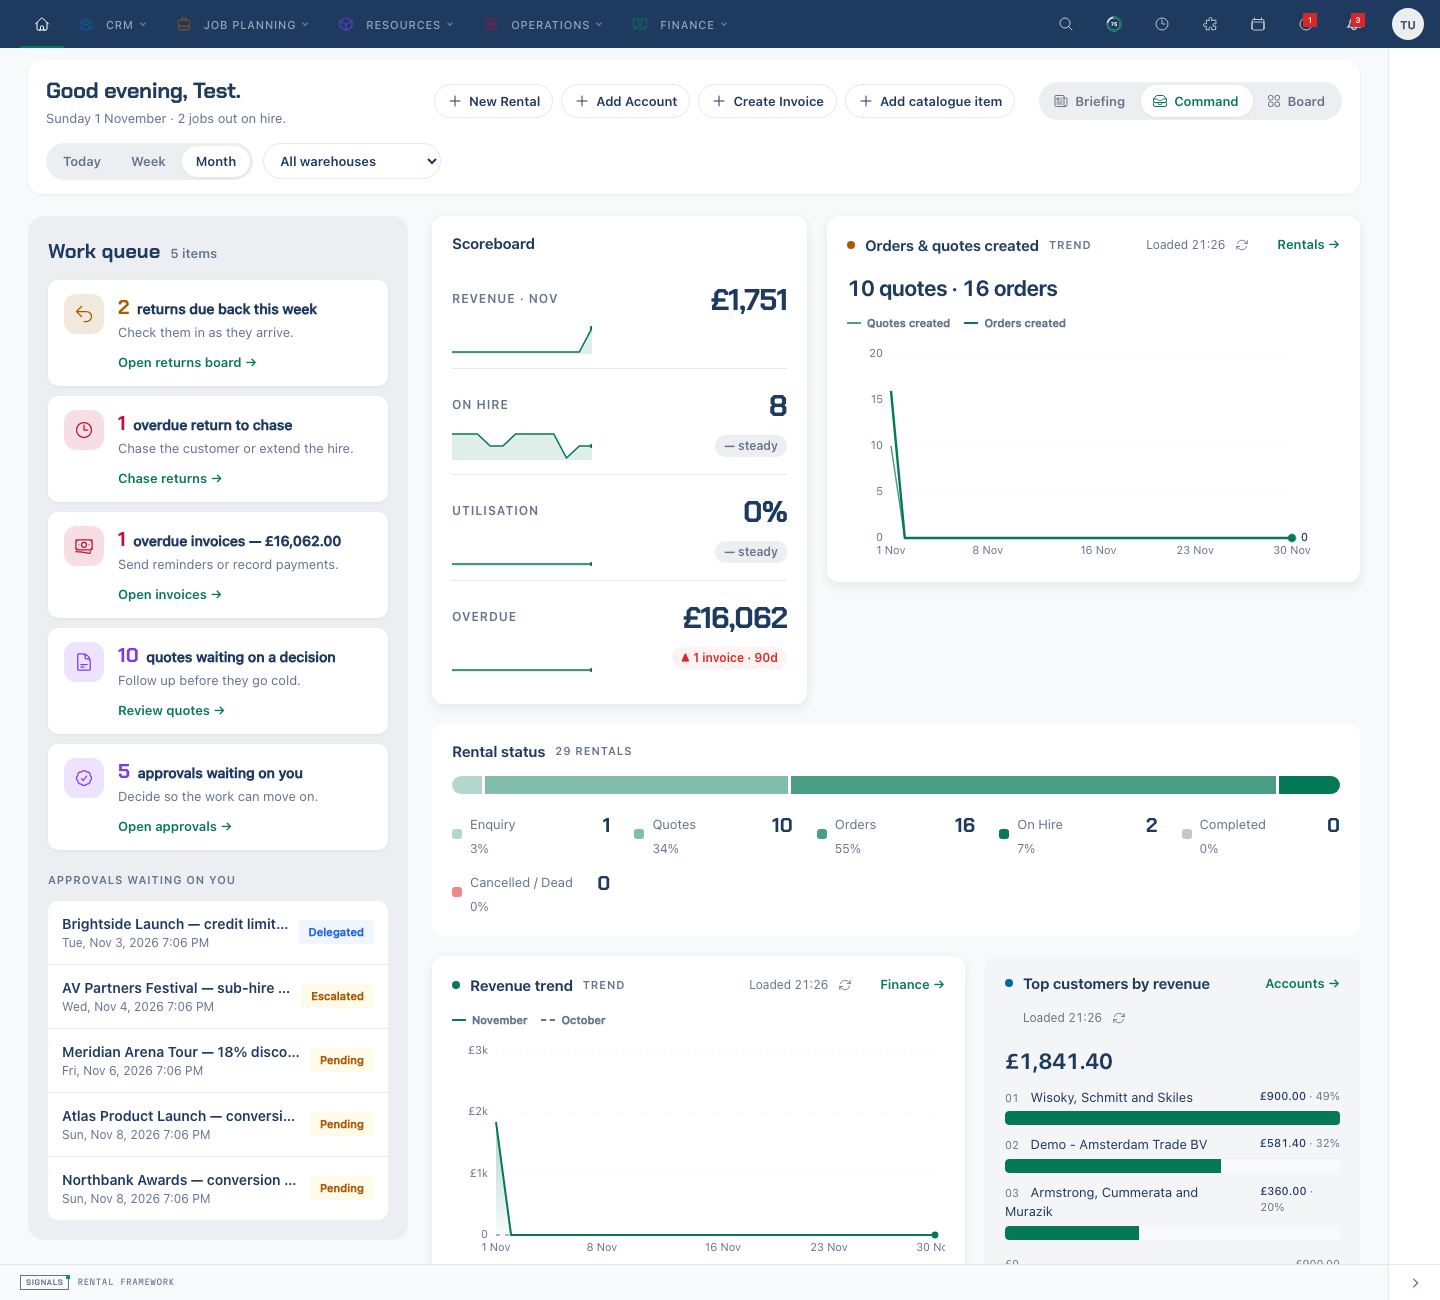
Pick the view that suits how you work
Each saved dashboard has one of three types:
| View | Best for |
|---|---|
| The briefing | A quick read of the day: one big number, the day in a sentence and the things that need you, then trends, flows and lists. This is the default. |
| Command centre | Working through what is waiting on you: a work queue of returns, overdue invoices, quotes and approvals beside a scoreboard of figures and charts. |
| Custom board | Building your own layout: add, arrange and resize widgets in groups, keep several boards, and open boards your team has shared with you. |
All three show only what your role allows and follow the same date range and warehouse filters. Headline revenue and the revenue chart use the selected date window; on-hire, overdue and utilisation figures describe the current position.
Switch view from the dashboard
- Open the dashboard.
- Use the Briefing / Command / Board control at the top. With the keyboard, tab to it and use the arrow keys.
- The view changes straight away and your preference is remembered. Opening a saved dashboard uses that dashboard’s own type.
Set your view in your settings
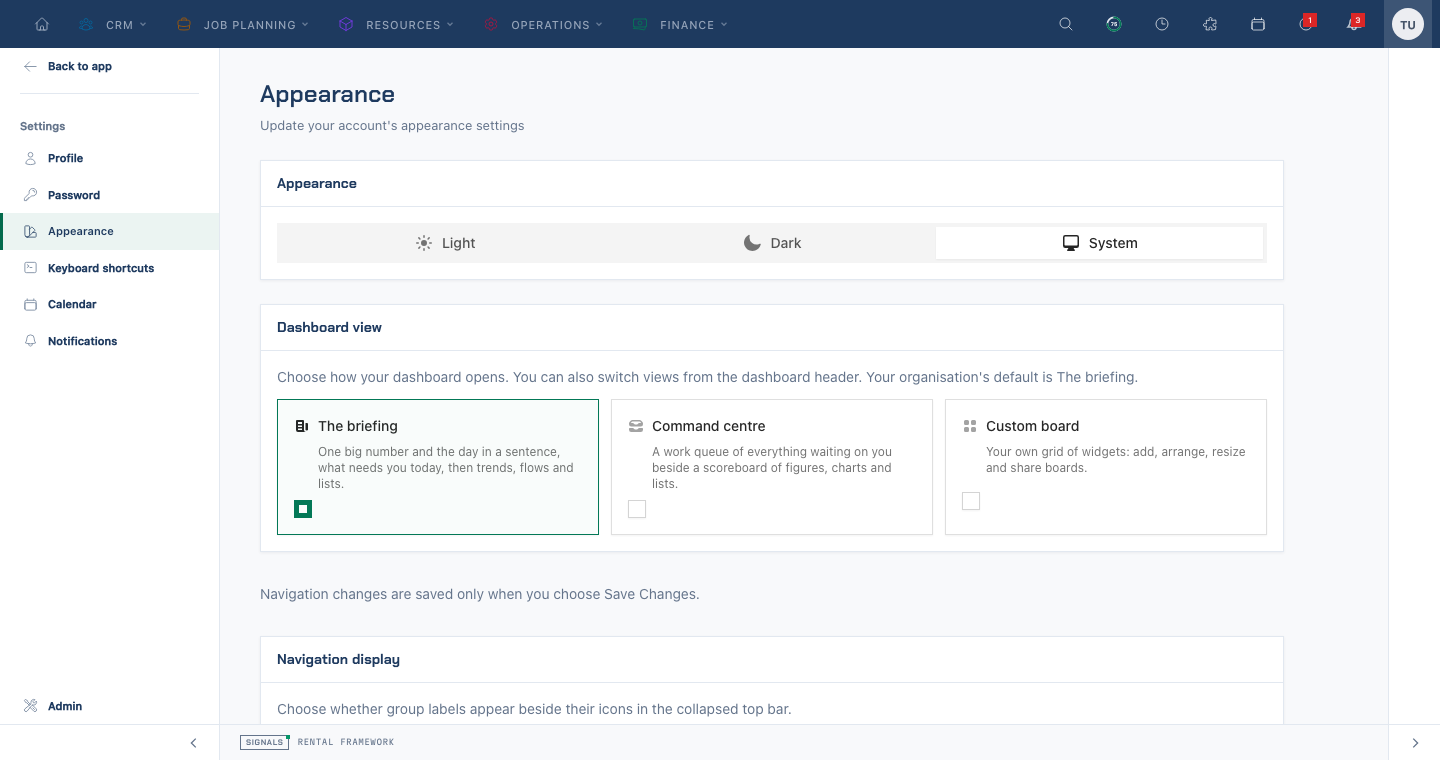
- Open Settings → Appearance.
- Under Dashboard view, choose The briefing, Command centre or Custom board. The choice saves as soon as you pick it.
Act on what needs you
In the briefing's Needs you today feed and the command centre's Work queue, each card names the count, what it is and why it matters, with one action — for example Chase returns, Open invoices or Open approvals. The approval card shows up to five visible pending requests; its count describes the requests shown, and Open approvals opens the full queue. Completed requests stay out of this feed. All clear appears only after the available attention sources load successfully and have nothing to show. If a source cannot load, use Retry; unavailable data is never treated as an empty queue.
Create a dashboard
- Select Add dashboard (+ beside the dashboard tabs), or open Dashboard settings → Manage dashboards → New dashboard.
- Choose Briefing, Command or Board and enter a Dashboard name.
- For Briefing or Command, pick Overview, Sales, Operations, Warehouse or Finance, or copy an existing dashboard of the same type. For Board, start Blank, use a role template or copy a board, then choose any Starter widgets.
- Select Create.
Customise and manage dashboards
Open Dashboard settings → Customise layout. Briefing and command dashboards let you show, hide and reorder cards within their columns. Boards let you add, move and resize widgets in groups. Changes save as you go; select Done to finish.
In Dashboard settings → Manage dashboards, use a dashboard's Briefing / Command / Board control to change its saved type. Its name and each type's layout are kept. You can also rename, reorder, duplicate or delete dashboards here.
Selecting a saved dashboard opens its type. The header view switcher changes the view you are looking at; it does not replace the saved type control in Manage dashboards.
Shared dashboards appear alongside personal dashboards and open in their published type, with a Read only badge. Administrators with settings access can use Dashboard settings → Share to publish a snapshot to selected roles or people. Later edits reach recipients when the share is republished.
Set the organisation default (administrators)
- Open Admin → Preferences → General.
- Under Dashboard, choose the Default dashboard view and select Save Changes.
This supplies the default when a person has not chosen a view. Opening a saved dashboard still uses that dashboard’s own type.